Reports provides graphs and charts for an at-a-glance, high-level overview.
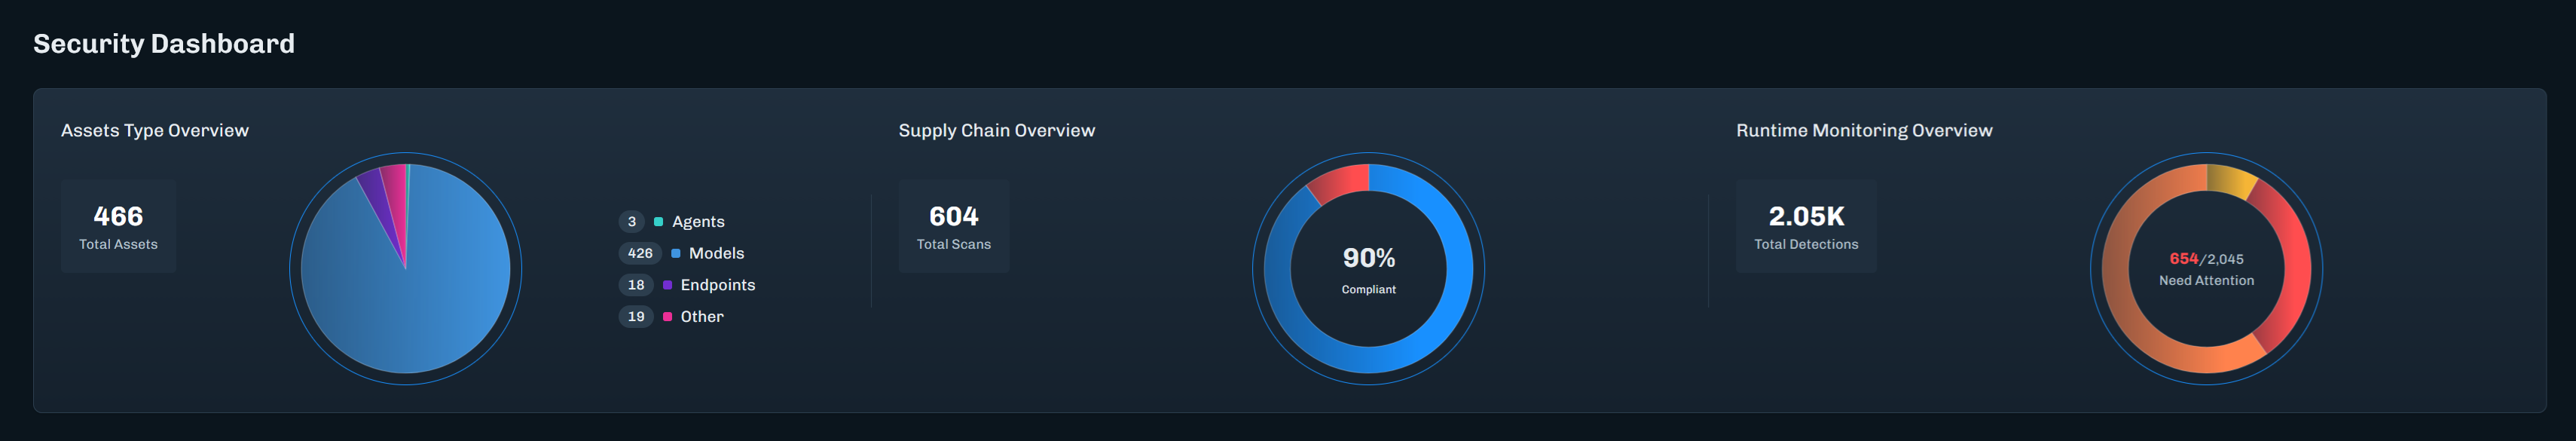
Displays the number of assets by type, Agents, Endpoints, Models, or Other.
- Hover over the circle graph to see the number of assets per asset type.
- The graph legend displays the number of assets per asset type.
Displays the number of scans that are compliant and non-compliant based on your policies.
- Hover over the circle graph to see the number of compliant (blue) and non-compliant (red) scans.
- The center of the circle graph highlights the percentage of complaint scans compared to the total number of scans.
Displays the number of detections in AI Runtime Security monitoring.
- Hover over the circle graph to see the number of High (red), Medium (orange), and Low (yellow) detections.
- The center of the circle graph highlights the number of High detections over the total number of detections.
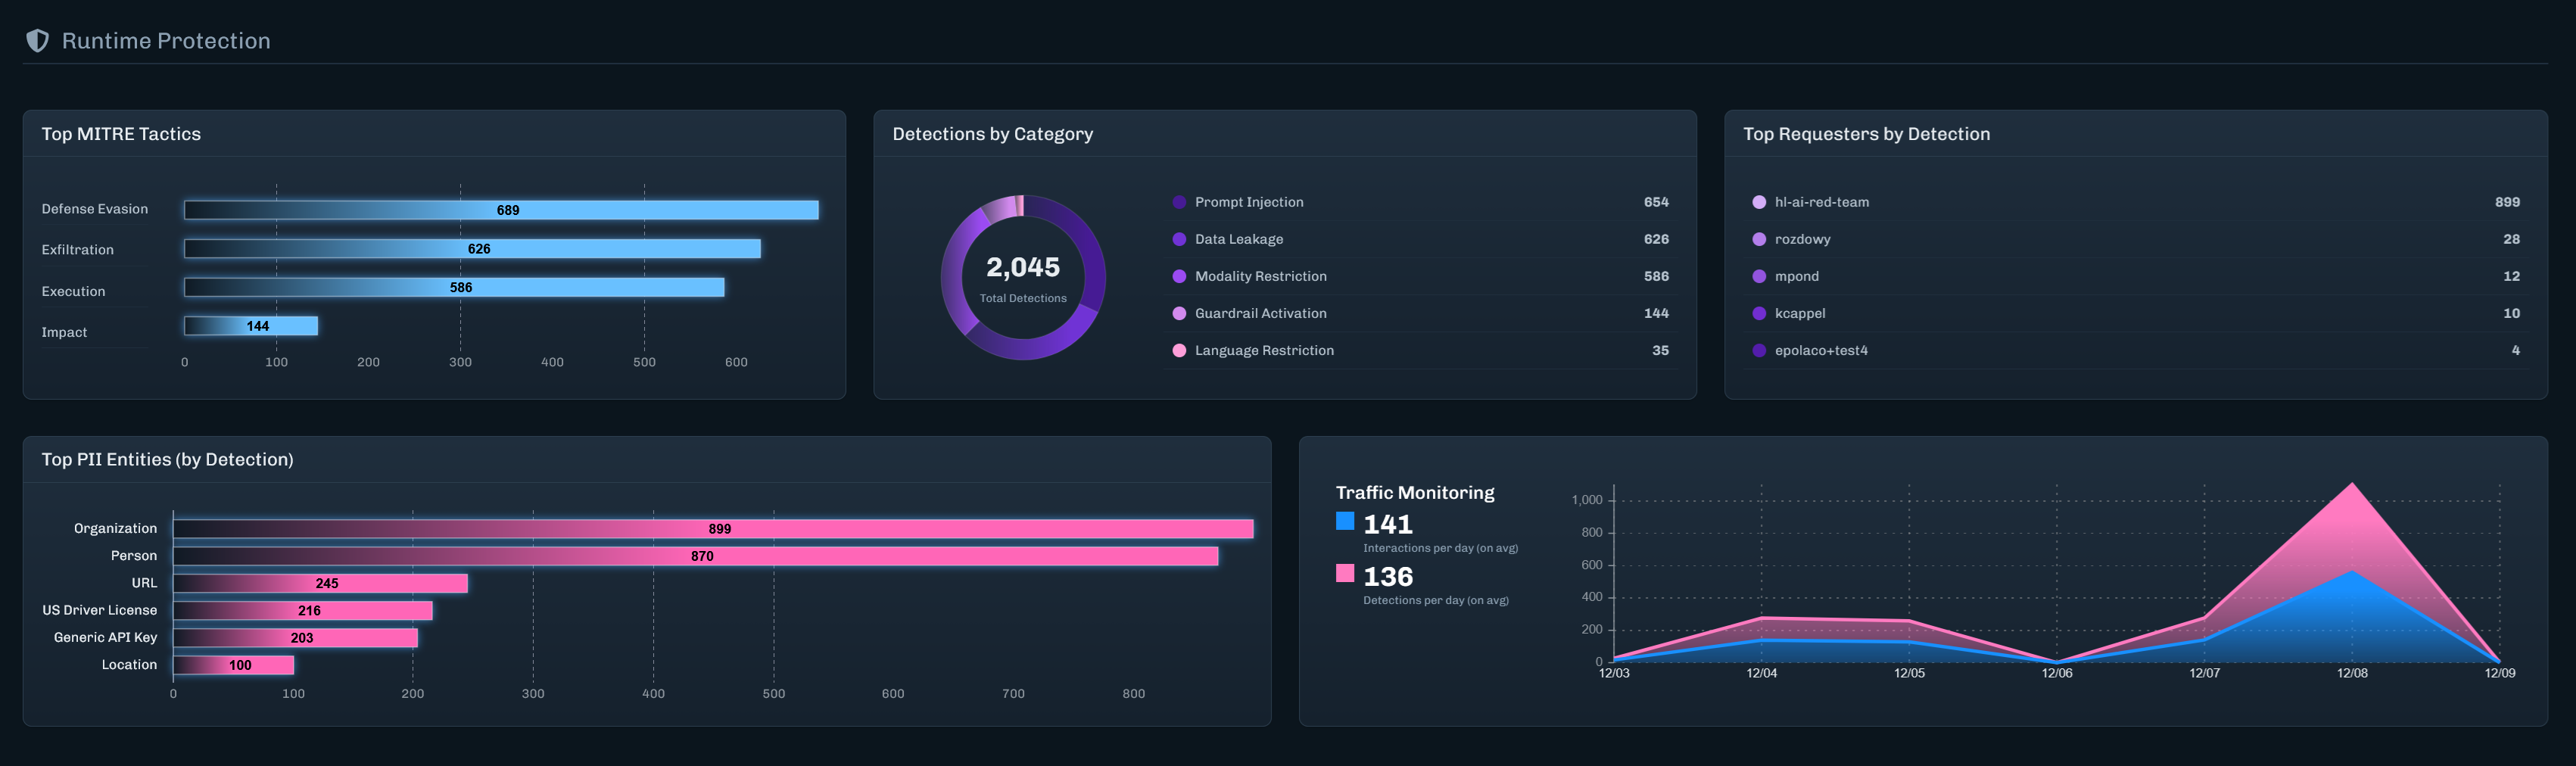
Displays the topic MITRE ATLAS tactics discovered and the number of detections for each tactic.
Displays the top Detection Categories discovered and the number of detections for each category.
- Hover over the circle graph to see the number of detections discovered for a specific category.
- The graph legend displays the number of detections discovered for a specific category.
Displays the top five requesters based on the number of detections found.
Displays the top Personally Identifiable Information (PII) entity types discovered and the number of detections for each PII entity.
Displays the number of Interactions and Detections per day, for the last seven days.
- Hover over the line graph to see the total number of interactions and detections for a given day.
- The graph legend displays the total number of interactions and detections for the last seven days.
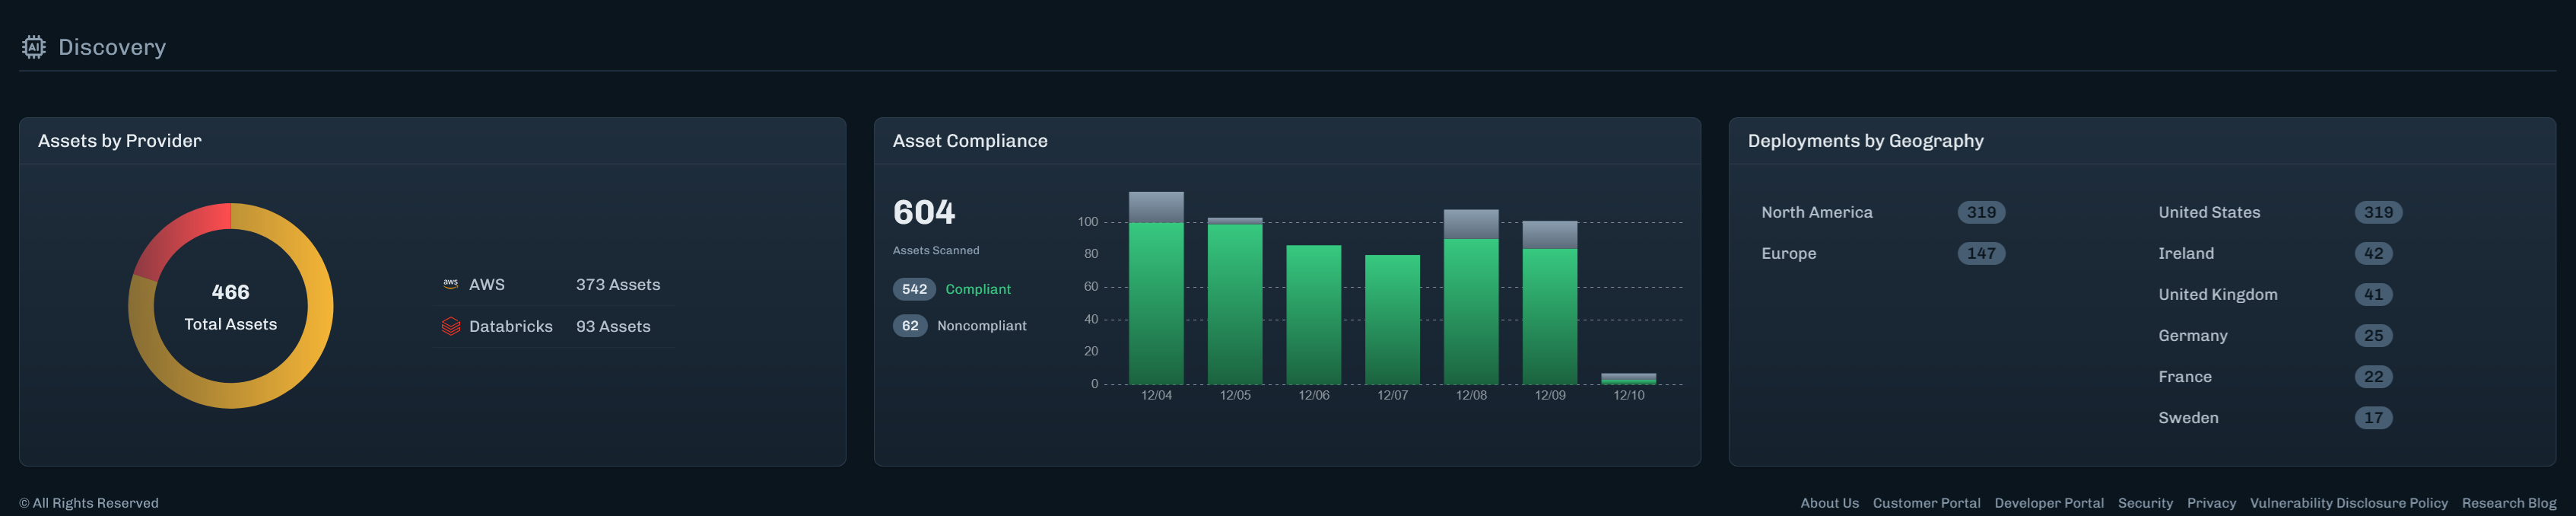
Displays the total number of assets and provides a breakdown by cloud provider.
- Hover over the circle graph to see the number of assets for a provider.
- The center of the circle graph displays the total number of discovered assets.
- The graph legend displays the number of assets by provider.
Displays the number of assets that are compliant and non-compliant based on the Supply Chain policy, over the last seven days.
- Hover over the bars in the graph to see the number of compliant and non-compliant assets for a given date.
- The graph legend displays the total number of compliant and non-compliant assets for the last seven days.
Displays number of deployments for your organization, by continent and by country.